
Foraging for misinformed real estate agents
My brother and I are buying in South Auckland, where everyone in the room knows more than we do. So I built a pipeline that reads every new Trade Me listing and flags the ones being sold by an agent who’s off their patch.

This was a go at buying a house with the informational advantage on our side for once.
Context
Agents are the experts of their own backyard. They know the price of everything and they know the deals before they go down.
Their mates know it too. They also don’t trust another realtor not to rip them off, so when they sell, they ask the agent they know.
Unfortunately for them, that mate lives on the other side of town. If the house is in South Auckland, that’s my brother’s home field, not the agent’s.
That’s the gap. Find the listings where the agent is working outside the patch they actually know, and the asking price should sit further from the true value (in either direction). Way too high because they’re out of touch, or way too low for the same reason. The low ones are where we buy.
How it’s built
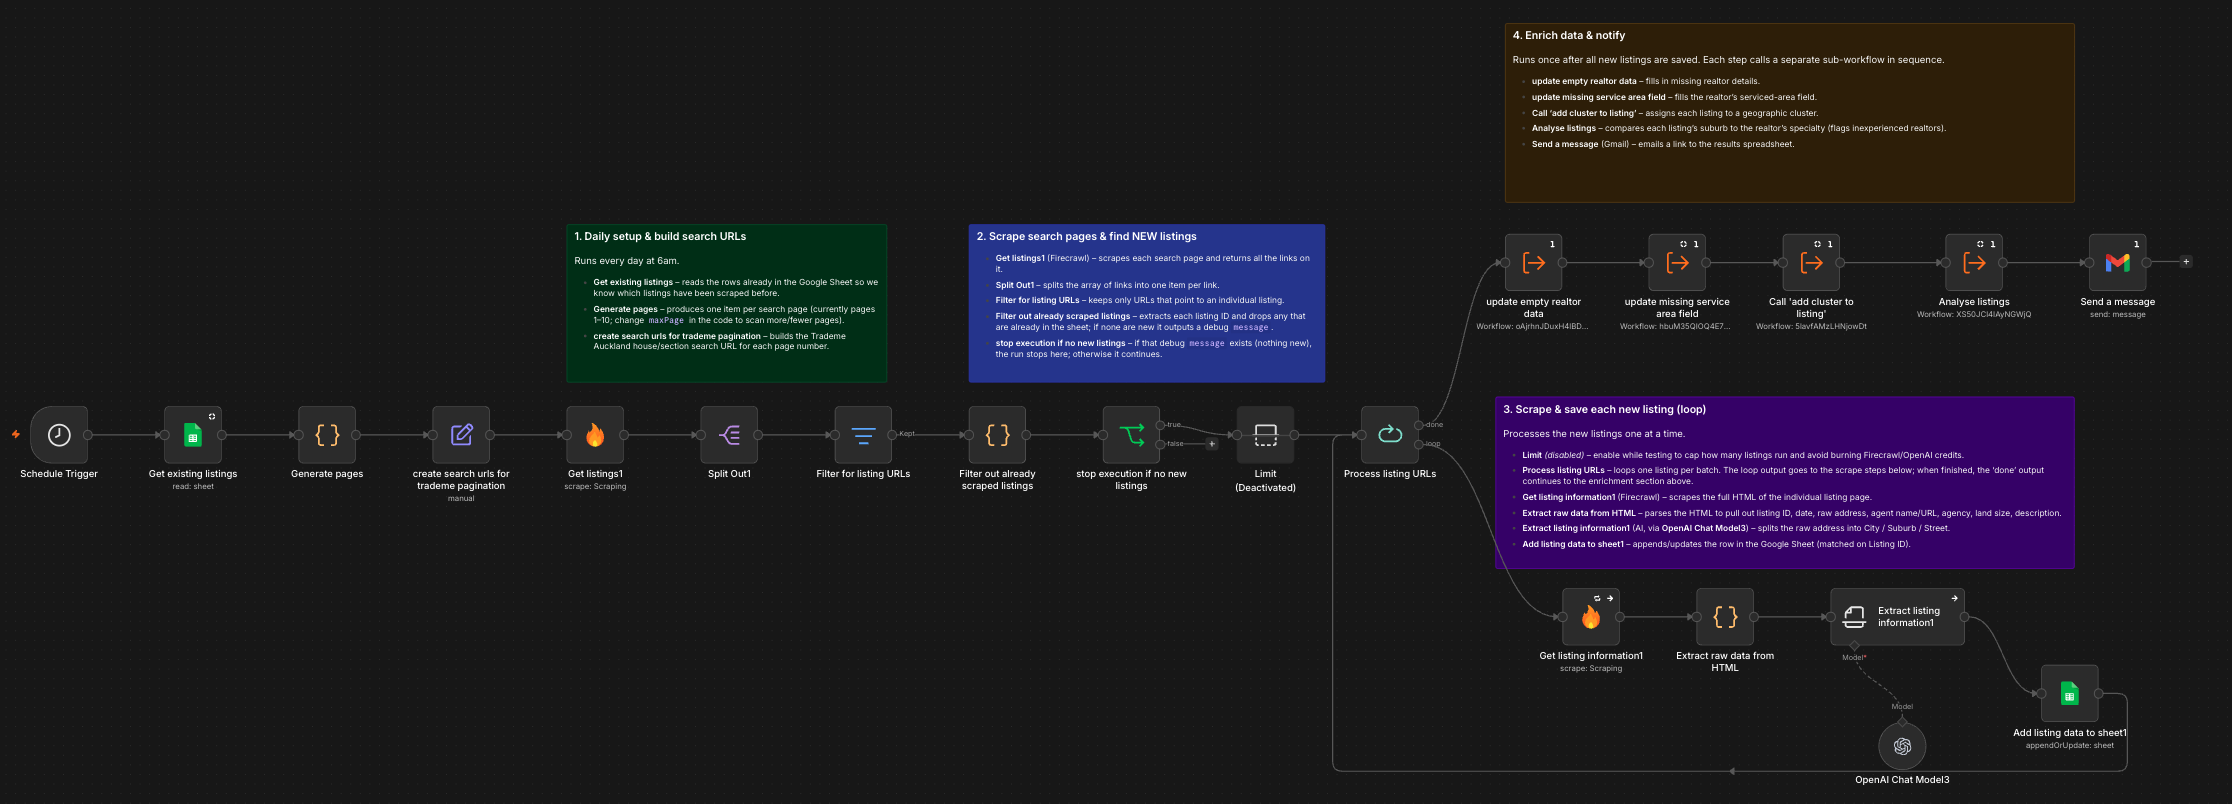
It runs at 6am every day in n8n, and most of the flow is spent working out whether the agent behind each listing is on home turf.
- n8n6am
1. Schedule Trigger
Forty or fifty new listings come through a day.
- Google Sheets
2. Get existing listings
Reads the sheet first, so it knows what it’s already scraped.
- n8n
3. Generate pages
One item per search page. maxPage is set to 10.
- Firecrawl
4. Get listings
Scrapes each search page and hands back every link on it.
- n8n
5. Filter out already scraped listings
Drops any listing ID the sheet has seen. Nothing new, the run stops.
- Firecrawl
6. Get listing information
The full HTML of one listing page, one at a time.
- n8n
7. Extract raw data from HTML
Listing ID, date, raw address, agent, agency, land size, description.
- OpenAI
8. Extract listing information
Splits the raw address into city, suburb and street.
- Google Sheets
9. Add listing data to sheet
Appends or updates the row, matched on listing ID.
- n8n
10. Call 'add cluster to listing'
Assigns each listing to a geographic cluster.
- n8n
11. Analyse listings
Compares the listing’s suburb to the agent’s active regions. Off the patch is the point.
- Gmail
12. Send a message
Emails a link to the results sheet.
The stack
- n8n · Runs the daily flow, the deduping, and the clustering.
- Firecrawl · Scrapes the search pages, the listings, and the agent profiles.
- Trade Me · Every listing and every agent profile comes from here.
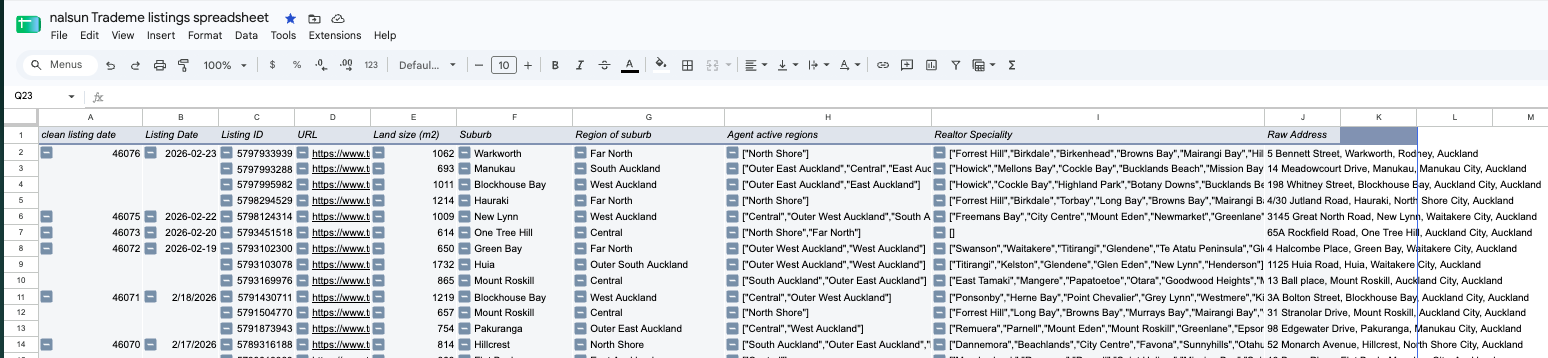
- Google Sheets · One row per listing, one row per agent.
- OpenAI · Splits each raw address into city, suburb and street.
- Gmail · Emails me the link to the sheet when a run finishes.
Working out where an agent actually sells
Every agent profile lists the regions they say they’re active in. Those get mapped onto a cluster of Auckland, the listing’s suburb gets mapped onto one too, and the check is whether the two match.
Learnings
Two months of running it turned up something I wasn’t looking for.
- Twelve hundred agents. That’s how many were active in Auckland alone while I ran this, against forty or fifty new listings a day. Which mostly scares me. The housing market here is lucrative enough to keep that many people fed.
- The hypothesis was half right. Out of patch agents do misprice, and they just about always misprice high. That call was my brother’s. There’s no price anywhere in the sheet, so he made it off his own feel for the market. Of the 268 that made the shortlist, nothing looked like a clear buy.
- Spreadsheets were the wrong container. I put it all in a spreadsheet so my brother and I could both look at it easily, and for that it worked. What it cost me was everything after: the data was much harder to clean and keep straight. Next time it’s a proper database with one view pushed out to him.
- Firecrawl is very good at the boring bit. It hands back clean HTML from a page that’s a mess, and it finds the URL you need with intent rather than off the structure of the page. I’ve since learnt that’s a non-trivial problem.
- Pin your data. This was my first n8n build, and I paid Firecrawl to re-scrape everything every single time I wanted to test one step. Pinning it once and testing against that is faster and free.
- Treat n8n like code. Everything goes in a function with clear inputs and outputs, or memory runs out and the app breaks.
Property insights
The sheet was still sitting there after we paused, so I went back through it properly. Everything below is the Auckland listings on sections over 600m², which is 2091 rows of the 3000.
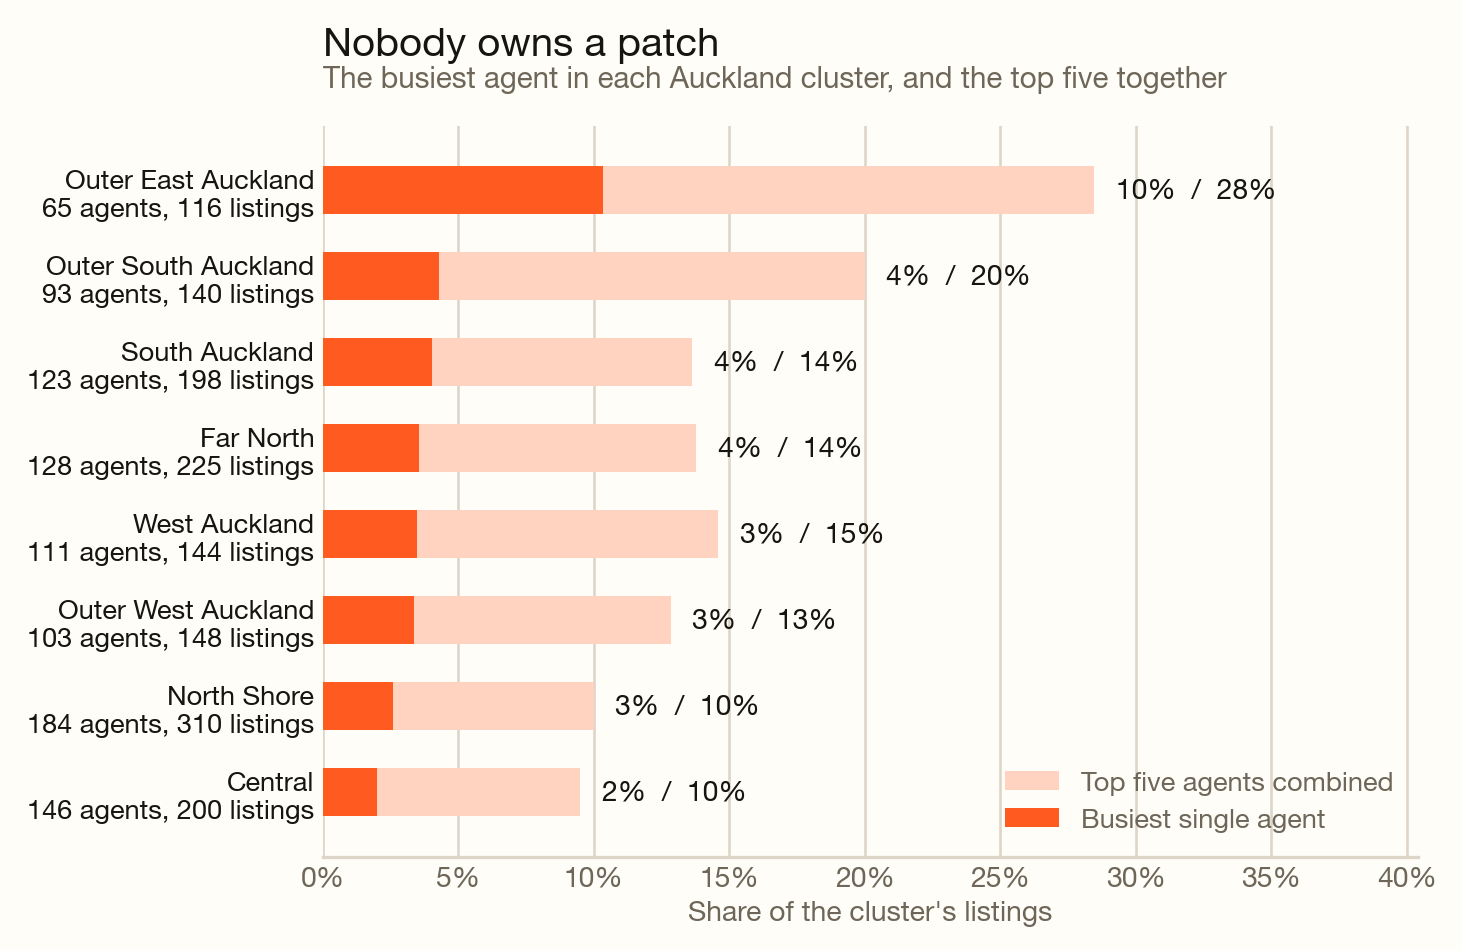
- Nobody owns a patch. The busiest agent in any cluster holds between 2% and 10% of its listings. Central is the most competitive, with 146 agents splitting 200 listings between them.
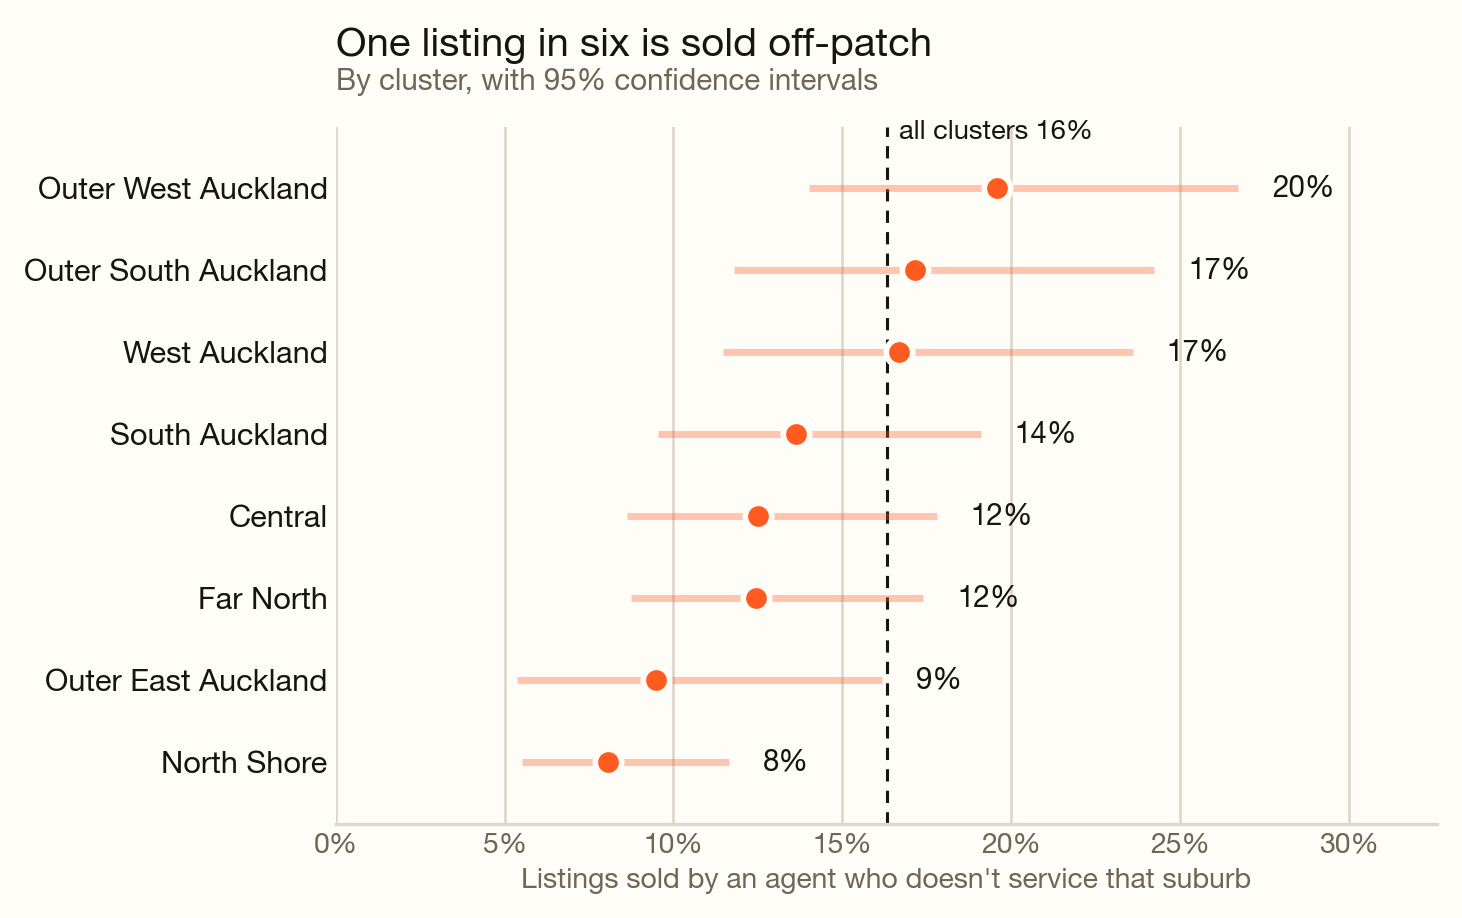
- One listing in six is sold off patch. 16% of the listings the check could score had an agent whose service area doesn’t cover that suburb. The North Shore is the tightest at 8%, Outer West the loosest at 20%.
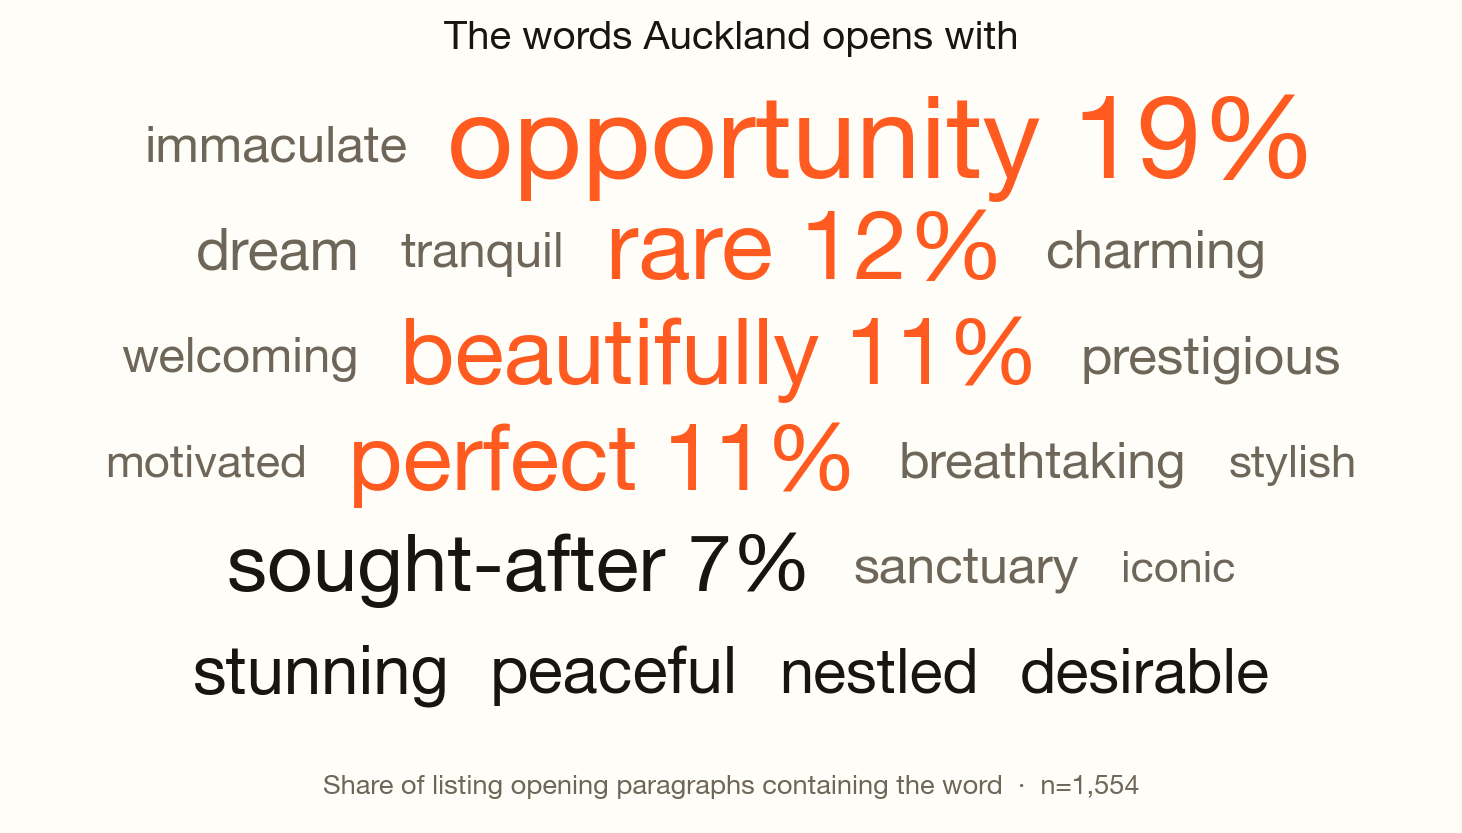
- 19% of listings start with opportunity. Agents reach for the same words when they write the hook for a property. Opportunity leads at 19%, then rare at 12%, and only after those do you get the words that describe the home itself.
Next steps
What’s still broken
The shortlist never surfaced a good buy across 3000 listings, so we paused it.
What I want to build
The plumbing is flaky. I’d add retry paths and a lot more testing to the app before I left it running hands off.
The collection and processing logic does work though, so I’m keen to point it at another hypothesis and go looking for mispricing somewhere else.
I went looking for agents who didn’t know what a house was worth. What I found is that being off your patch makes you price high, which is no use to a buyer. The hypothesis didn’t hold, but the collection and analysis stack did.